| Xbase++ Inspector Documentation |  |
Overview Documentation Xbase++ Inspector Aspect Oriented API What's new? |


Index
What is Inspector?
Xbase++ Inspector User Interface
Inspector Mode
Databases Mode
Memory Mode
Threads Mode
What is Inspector?
Xbase++ Inspector is integrated in application hotkey activated pop-up multifunctional console. You can press hotkey (default is one-hand Ctrl-Shift-Z) and:
• execute multiline code in any running Xbase++ thread and see results
• view current snapshot of opened databases of all threads
• view full info about used memory from Xbase++ programmers point of view
• view callstacks of all threads with priority/workload info
In additional, Inspector save its status (position, typed code, results and settings) between sessions. So, if you pop-up Inspector after some days it will be shown in predicable state.
Xbase++
Inspector User Interface
This tool based on our forthcoming GUI library. This GUI greatly extend the standart Xbase++ Parts. All dialog elements of Inspector's UI is native Xbp-objects with new look'n'feel.
| On top of dialog you can see tabs of main modes of Xbase++ Inspector. |
|
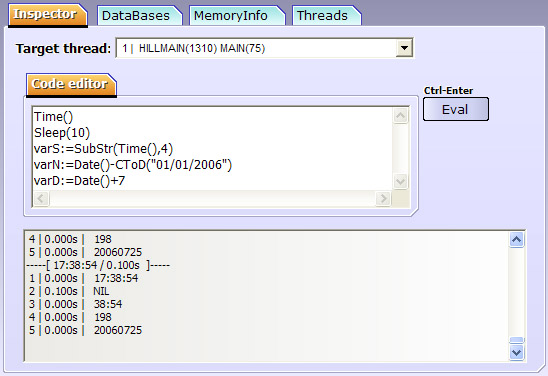
In this mode you can evaluate any Xbase++ compatible code. You can type any number of codelines and eval its in context of any running Xbase++ thread.
The results of evaluation for every line displayed in output window.

Target thread property
You can select the thread for evaluating code in list of all currently running threads. For every thread also displayed current callstack. A list automaticaly refreshed every second.
Code editor entry
This is a mini source code editor. You can enter almost unlimited number of codelines. We add new hotkeys to default XbpMle behaviour, the Ctrl-A selects all text and Ctrl-Enter execute all code.
Eval button
This button execute code from Code editor
Output view
Results of code execution shown in this window. Also, you can see start time of execution, total elapsed time and time of execution for every line of code. If an error was occured while execution of an expression, the Xbase++ Inspector show complete description of error.
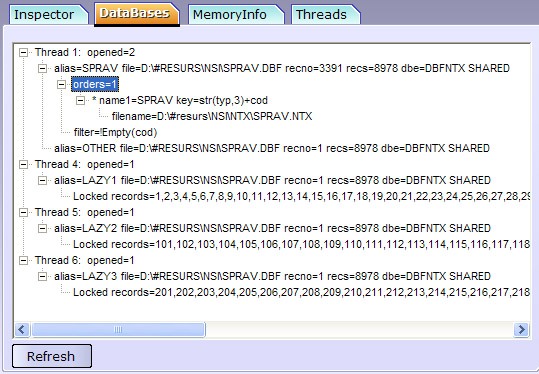
In this mode you see opened databases grouped by threads. The description tree include following elements for every database:
• database filename and alias, current record, number of records, open mode (shared, readonly, remote, client/server and descend), name of database engine (DBE), BOF/EOF status and Found() flag
• lock status, including a list of locked records
• list of used indexes with filename, order name (tag), index key, FOR expression, index mode (candidate, custom, subindex, descend and unique properties). Current order marked by "*" sign.
• filter expression
• database cargo value
Refresh button
This button refresh databases info.
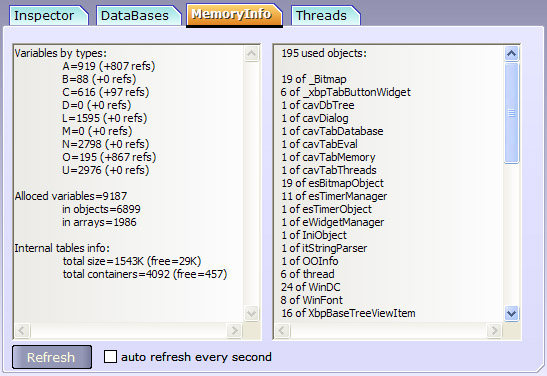
In this panel you can see two windows, one for used variables and one for used objects.

Variables and Memory view
The variables window have following stat :
• statistic of currently used variables, grouped by types. For every Xbase++ type was shown number of alloced variables of this type and number of references to variables of this type.
• total alloced variables and variables contained in arrays and objects (Xbase++ holds arrays elements and objects ivars in different manner than simple variables)
• info about internal memory allocation. Xbase++ have two tables for variables, one for containers headers (an container can be variable, reference, some other internal value) and other for container values and plain alloced memory.
Objects view
In this window you can see number of currently used objects and list of objects by names.
Refresh button
This button refresh statistic info.
Auto refresh checkbox
If this checkbox is on, statistic info will be refreshed every second.
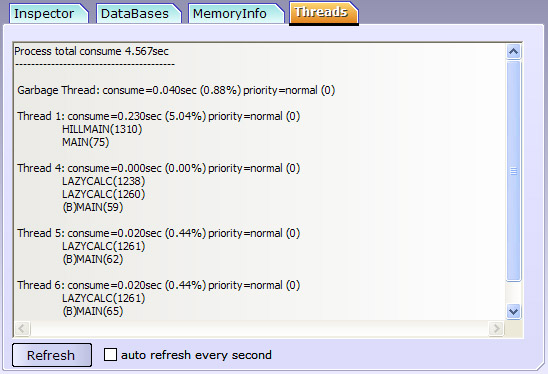
In this panel you can see info about currently running threads and other process information:
• total consumed time of application (process). This is a time of actual used processor cycles, not a runned time.
• garbage collector consumed time and percentage of total consumed time. Also displayed current priority.
• consumed time, percentage of total consumed time and priority for every Xbase++ thread. Also displayed full callstack of thread.
Refresh button
This button refresh info about threads.
Auto refresh checkbox
If this checkbox is on, statistic info will be refreshed every second.
©2006
Eleus Software

